Ver el uso de memoria de un script
Si un script nos consume mucha RAM podemos monitorizarlo para ver qué es lo que está consumiendo.
Instalación
Para poder monitorearlo vamos a instalar memory_profiler. Lo podemos instalar con Conda
conda install memory_profiler
o con pip
pip install memory_profiler
Uso
Decorador
Podemos poner un decorador en la función que queremos monitorizar.
from memory_profiler import profile

      @profile
      def my_function():
          pass
InputPython%%writefile memory_profiler_decorator.pyfrom memory_profiler import profile@profiledef my_function():a = [1] * (10 ** 6)b = [2] * (2 * 10 ** 7)del breturn aif __name__ == '__main__':my_function()Copied
Output
Overwriting memory_profiler_decorator.py
Ahora lo ejecutamos usando -m memory_profiles memory_profiler_decorator.py
InputPython!python -m memory_profiler memory_profiler_decorator.pyCopied
Output
Filename: memory_profiler_decorator.pyLine # Mem usage Increment Occurrences Line Contents=============================================================3 49.5 MiB 49.5 MiB 1 @profile4 def my_function():5 57.0 MiB 7.5 MiB 1 a = [1] * (10 ** 6)6 209.6 MiB 152.6 MiB 1 b = [2] * (2 * 10 ** 7)7 57.2 MiB -152.4 MiB 1 del b8 57.2 MiB 0.0 MiB 1 return a
Como vemos, obtenemos el uso de memoria de cada línea del script.
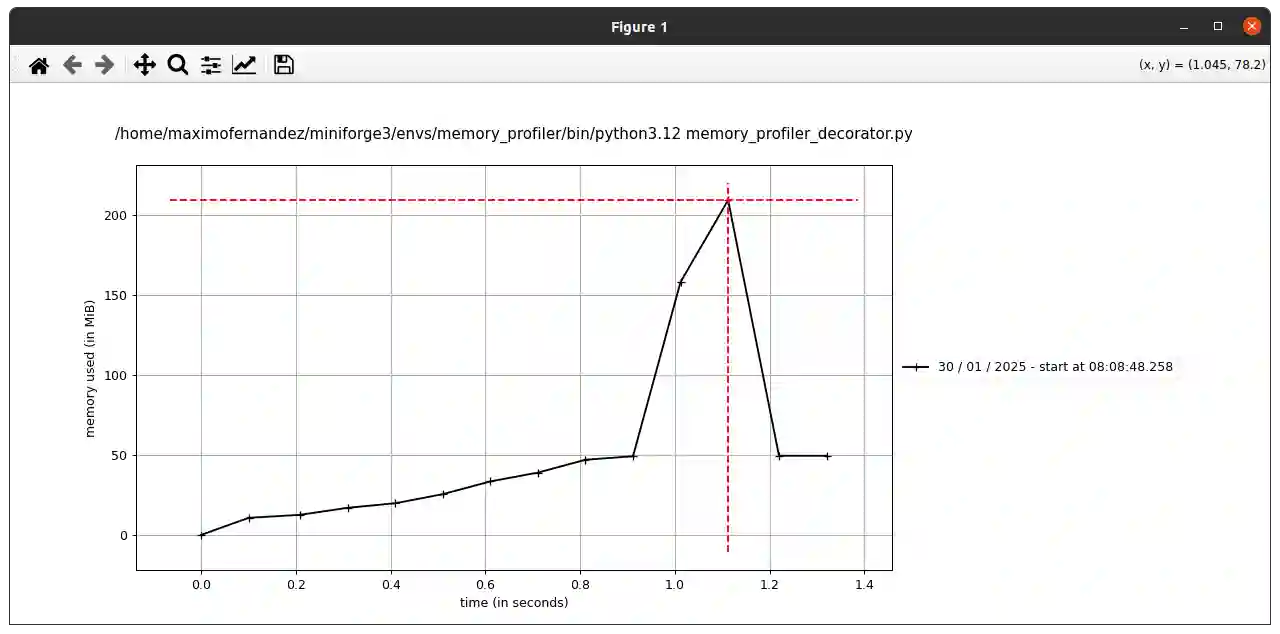
Uso de memoria en el tiempo
Podemos obtener una gráfica del uso de memoria en el tiempo haciendo
mprof run memory_profiler_decorator.py
      mprof plot
InputPython!mprof run memory_profiler_decorator.pyCopied
Output
mprof: Sampling memory every 0.1srunning new processrunning as a Python program...Filename: memory_profiler_decorator.pyLine # Mem usage Increment Occurrences Line Contents=============================================================3 49.5 MiB 49.5 MiB 1 @profile4 def my_function():5 57.0 MiB 7.5 MiB 1 a = [1] * (10 ** 6)6 209.6 MiB 152.6 MiB 1 b = [2] * (2 * 10 ** 7)7 57.2 MiB -152.4 MiB 1 del b8 57.2 MiB 0.0 MiB 1 return a
InputPython!mprof plotCopied
Output
Using last profile data.Figure(1260x540)
Al ejecutarlo se crea esta gráfica