View the memory usage of a script
Disclaimer: This post has been translated to English using a machine translation model. Please, let me know if you find any mistakes.
If a script is consuming a lot of RAM, we can monitor it to see what is consuming it.
Installation
To monitor it, we are going to install memory_profiler. We can install it with Conda.
conda install memory_profiler```

      or with pip
      ``` bash
      pip install memory_profiler```
Usage
Decorator
We can put a decorator on the function we want to monitor.
from memory_profiler import profile
      @profiledef my_function():pass```
InputPython%%writefile memory_profiler_decorator.pyfrom memory_profiler import profile@profiledef my_function():a = [1] * (10 ** 6)b = [2] * (2 * 10 ** 7)del breturn aif __name__ == '__main__':my_function()Copied
Output
Overwriting memory_profiler_decorator.py
Now we run it using -m memory_profiles memory_profiler_decorator.py
InputPython!python -m memory_profiler memory_profiler_decorator.pyCopied
Output
Filename: memory_profiler_decorator.pyLine # Mem usage Increment Occurrences Line Contents=============================================================3 49.5 MiB 49.5 MiB 1 @profile4 def my_function():5 57.0 MiB 7.5 MiB 1 a = [1] * (10 ** 6)6 209.6 MiB 152.6 MiB 1 b = [2] * (2 * 10 ** 7)7 57.2 MiB -152.4 MiB 1 del b8 57.2 MiB 0.0 MiB 1 return a
As we can see, we get the memory usage of each line of the script.
Memory usage over time
We can obtain a memory usage graph over time by doing
mprof run memory_profiler_decorator.pymprof plot```
InputPython!mprof run memory_profiler_decorator.pyCopied
Output
mprof: Sampling memory every 0.1srunning new processrunning as a Python program...Filename: memory_profiler_decorator.pyLine # Mem usage Increment Occurrences Line Contents=============================================================3 49.5 MiB 49.5 MiB 1 @profile4 def my_function():5 57.0 MiB 7.5 MiB 1 a = [1] * (10 ** 6)6 209.6 MiB 152.6 MiB 1 b = [2] * (2 * 10 ** 7)7 57.2 MiB -152.4 MiB 1 del b8 57.2 MiB 0.0 MiB 1 return a
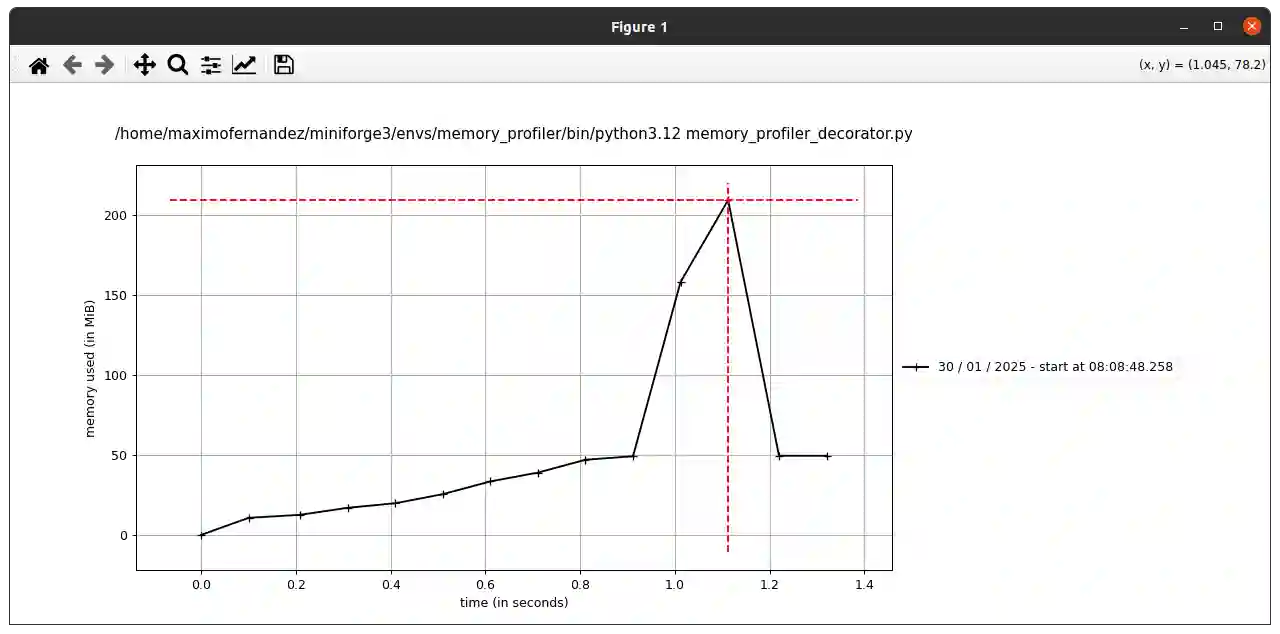
InputPython!mprof plotCopied
Output
Using last profile data.Figure(1260x540)
When running it, this graph is created